It’s almost November and by my count construction is wrapping up on 33 lifts across the US and Canada. With the usual caveat that there could be a lift project I haven’t heard about, 2015 will be the fourth year in a row that the total number of new lifts has declined. Nonetheless there are some encouraging trends – namely more of this summer’s lifts were (expensive) detachables and more were brand new rather than re-installations of used lifts.

Looking geographically, there’s no question the dismal snow situation last winter killed the market for lifts in the Sierras and Cascades. In a typical year, Washington, Oregon and British Columbia account for five new lifts and this year they had zero. The Rockies were a bright spot this summer, with at least one new lift being built in every Rocky Mountain state except Montana. Colorado had a particularly strong year, building five new lifts including four detachables. Utah had almost as good a year, thanks largely to Vail Resorts’ mega-project at Park City. Colorado averages 4.4 new lifts a year and Utah 3.3 and both came out ahead of those numbers this summer.
The Midwest was about average for snowfall last winter but its ski areas built just one new lift and one used lift this year. The one bright spot was Lutsen in Minnesota which spent $7 million with Doppelmayr to rebuild the Midwest’s only gondola. Looking further east, Vermont was a success story, getting three brand new lifts from both Leitner-Poma and Doppelmayr. Despite averaging more than five new lifts a year, nowhere else in the Northeast invested in a new lift despite a stellar winter in 2014-15.
Canada had a tough year with only three lifts going in at Sunshine Village, Boler Mountain and Mont Cascades. In a normal construction season the country’s resorts build 7-8 new lifts. My take is newer resorts in Western Canada – places like Sun Peaks, Revelstoke and Kicking Horse – were hit particularly hard by the Great Recession and still haven’t recovered.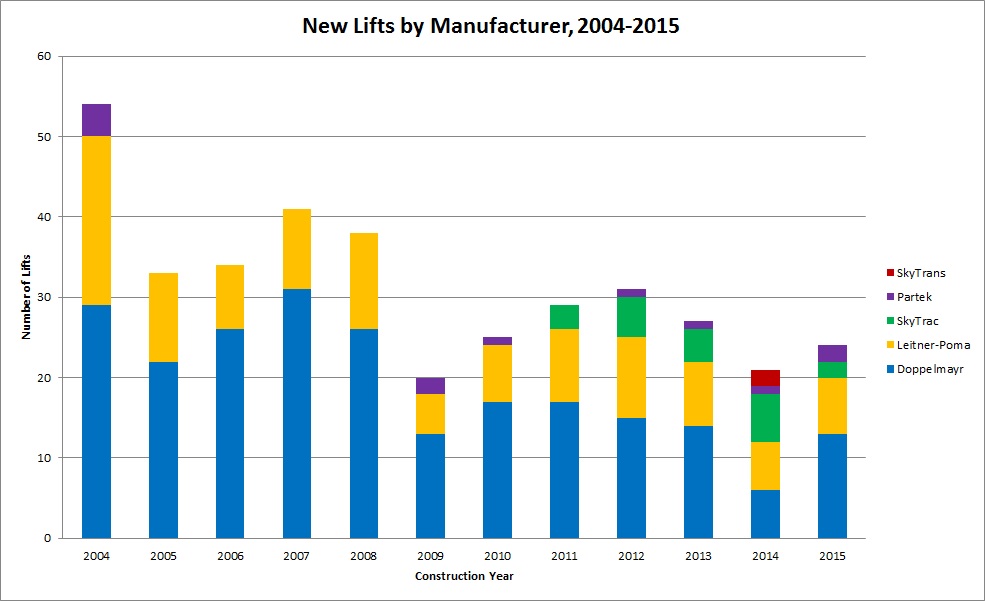
The manufacturer story could be summed up as “back to normal.” Last year was a total fluke with the two majors and SkyTrac each building exactly six lifts in 2014. Doppelmayr regained their typical market lead this summer building 13 lifts including ten detachable gondolas and chairlifts. Despite the win, Doppelmayr built about half as many lifts as they were building ten years ago. Leitner-Poma was right about at their ten-year average of 7.6 new lifts per year. L-P’s seven projects in 2015 included three detaches and four fixed-grips (I didn’t count Powderhorn’s detachable quad in these numbers since it wasn’t completely new.)
SkyTrac had a down year building only two complete lifts, their fewest since 2011. Hopefully they will be a bigger player next year like they were last summer. I still don’t know what to make of Partek Ski Lifts, which built a quad and triple chair this summer in New Jersey. The company was supposedly bought by Doppelmayr CTEC in 2005 but brand new Partek lifts started appearing again in 2009. If anyone can reveal the story please chime in!
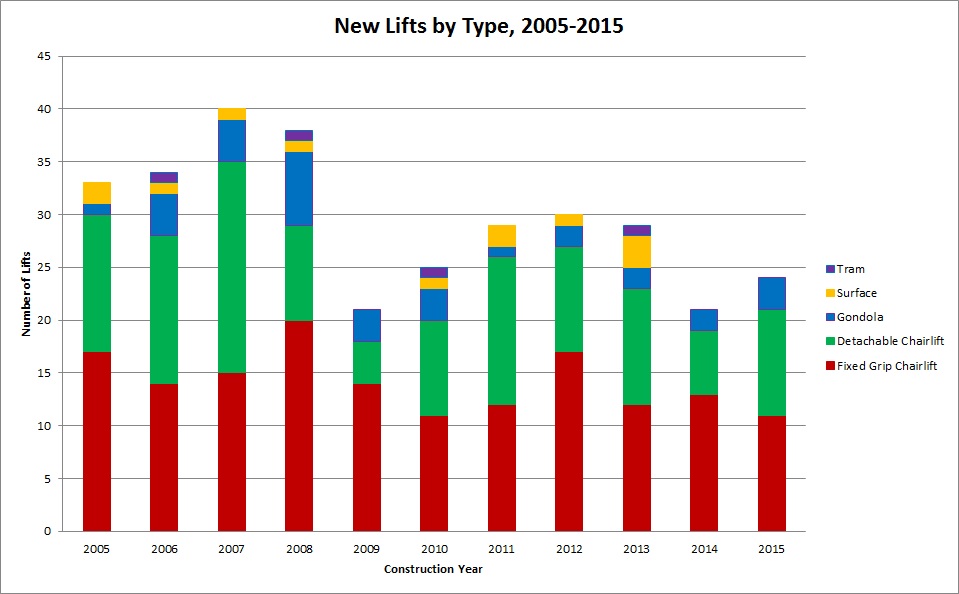
The best news for 2015 was just how many detachable gondolas (3) high speed quads (7) and six packs (5) went in. New fixed-grip chairlifts were at a ten-year low with 10 built while detachables were at a five-year high with 15 built. For the second year in a row, not a single new aerial tramway or surface lift was constructed.
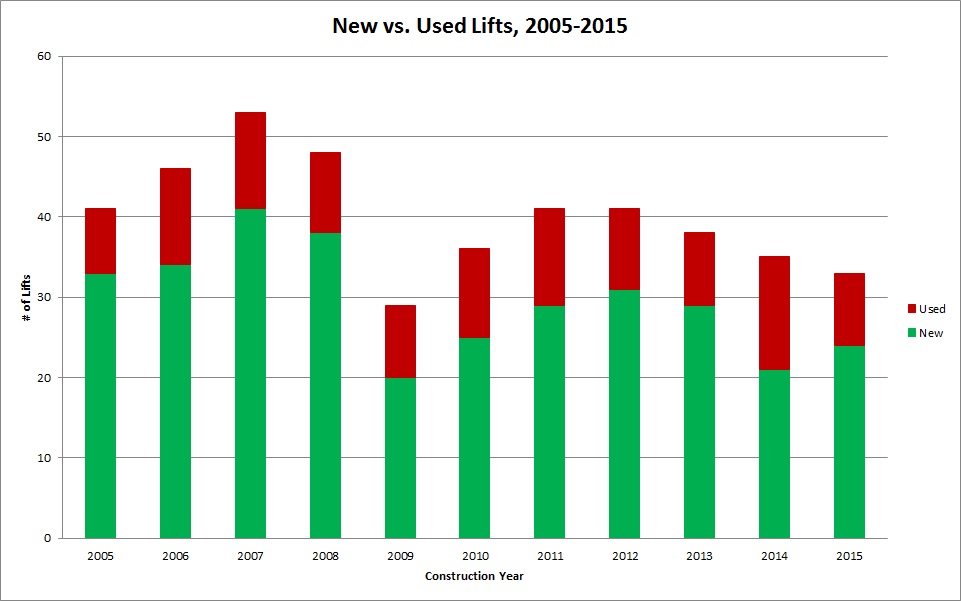
The other bright spot for the lift manufacturers is that more of the lifts that went up this summer were completely new – 73 percent versus 60 percent last summer. Ski areas built 2.6 new lifts for every used lift they re-installed this year versus the ten year-average of 2.9 to 1 new vs. used.
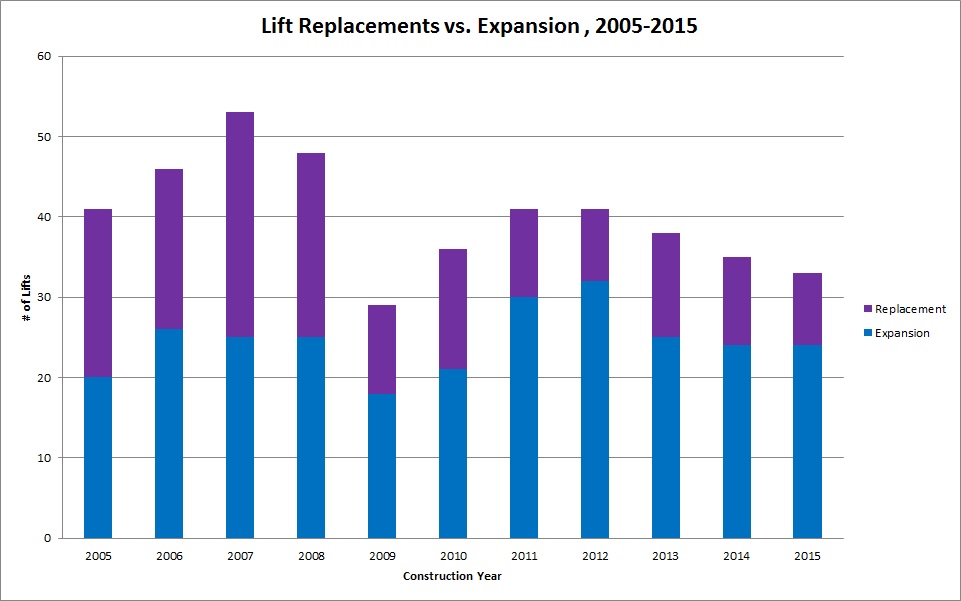
This last chart is something new that I haven’t tracked before. All the charts above look purely at the numbers of machines being built over time. But it’s also important to look at how and where lifts are being applied. So for this chart I took all the lifts built over the past ten years and categorized them either as direct replacements for another lift (or multiple lifts) or completely new applications. The latter could be either a terrain expansion or filling in a gap within existing ski terrain. The results surprised me. Conventional wisdom is that ski areas are expanding less than ever before and simply replacing aging lifts. I found the opposite to be true, at least for recent history. More lifts are going in completely new places rather than directly replacing older lifts. I’m not sure whether this trend is good or bad; as a skier I love the idea of lots of expansions but there are a lot of old lifts out there that need to be replaced.
Ski Area Management will come out with their own report and conclusions about 2015 in January along with detailed VTFH data. It’s way too early to say much of anything about next summer but you can keep track of my 2016 new lifts and map here. Most importantly on that front, think snow!

I found the last graph fascinating. In 2008 and before, expansions and replacements were relatively similar, but that significantly changed in 09. I’m curious as to why. Glad I stopped by.
LikeLike